Just a visualization of how the cubes could be arranged.
Initial setup

Possible shifts

Postdoctoral Research Associate (Chemistry)
Just a visualization of how the cubes could be arranged.
A visualization of how good of a model the minimum enclosing box is when applied to a real crystal structure.


The alpha shapes do not overlap. For some alpha.

The convex hulls of Cage 3 overlap.

I started work with only with one enclosing box and then to continue to build upon that.
I took one enclosing box and constructed a unit cell by surrounding this central box by other boxes (as is visualized in previous post). Next I “optimized” lattice energy by Lennard-Jones potential using the centers of mass of the CC3 molecule. The central cube can by moved in 3-directions (x,y,z) but out of symmetry it’s sufficient to move only in direction in this particular case. The center of mass of CC3 is slightly off the center of mass of the small cube. That means there are 16 rotations of the central cube that can be potential minima of the energy function.
The result can by seen by below. The dots are centers of mass of CC3. The minimum was attained with no rotation of the central small box.


Slides from the presentation: lattice_packings.pdf
Minimal enclosing box computed via. O’Rourk’s algorithm. The box is actually a cube:

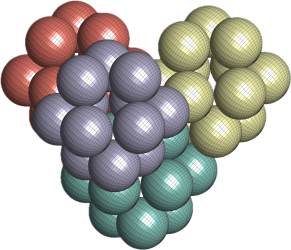
27 of these boxes stacked together forming a unit cell:

The procedure for choosing output weights. First the training reservoir signals were collected and TE matrix was computed based on these signals. Next the mean TE of target unit was computed and only those units where chosen for output matrix computations which mean TE was higher then some Threshold. The threshold went from the minimum mean target TE to the maximum mean target TE in 100 steps. This was repeated 100 times. The network settings were same as in the IJCNN article for comparability reasons.


This time with normalized (mean=0, variance=1) input + added a new input dataset (Multiple sinewave oscillator aka MSO)


I have added spectral radius scaling of reservoir matrix to desired value  along
along  and
and  parameters in W
  N(0,
N(0, ) and
) and  Unif(-,) to the exploration.
  neuron reservoir was used and instances for every pair (, ) were generated.
The Z values are mean NRMSE from 100 instances.


Minimum achieved mean:

Exploration of and parameters in W N(0,) and Unif(-,). neuron reservoir was used and instances for every pair (, ) were generated.


Minimum mean:


