After running the packing algorithm, the next question is how to generate an arbitrary number of sufficiently dense structures.
One way to do this is to keep all the feasible and repaired configurations sampled at each iteration of the optimization process. For instance, after using the method described here https://milotorda.net/etrpa-repairing-unfeasible-solutions/ , I obtained  packings
and out of these I select those with densities higher than  which leaves me with
  structures
Still quite a lot. Lets reduce it even further by clustering. Most likely many of the structures are quite similar to each other and my goal is to identify the most dissimilar ones.
To do this, I did a single-linkage hierarchical clustering on the configurations using the standard Euclidean distance. Given that the underlying configuration space is a  -dimensional unit flat torus, the metric coincides with the metric of that of
  , thus making sure that the single-linkage hierarchical clustering respects the geometry of my configuration space.
Suppose I want to have a selection of  most distinct structures. To do this, I cut the dendrogram tree at a level where it has leaves (in terms of Topological Data Analysis I create a Čech complex with connected components)

and within each cluster the configuration with the highest packing density, leaving me with structures
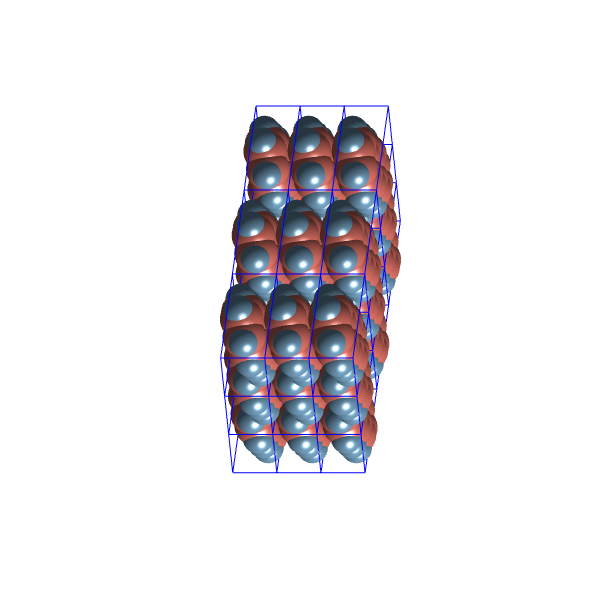
Let’s have a look at the packing configurations of the two most distinct clusters:
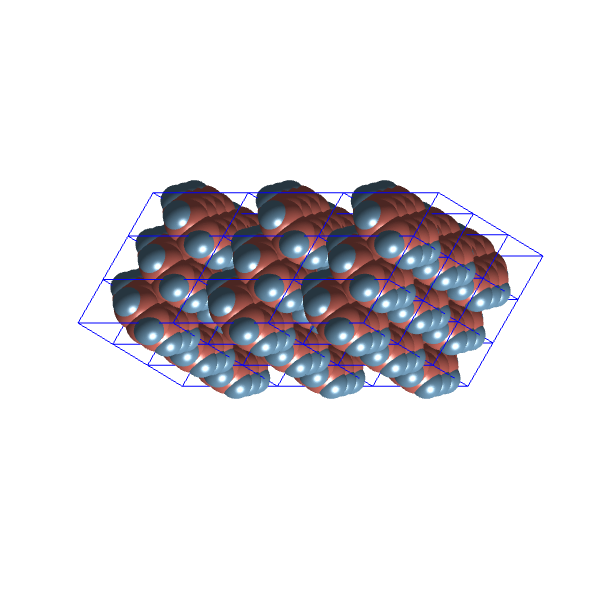
Density 
Density 
These structures seem quite similar, possibly due to the limited variability allowed within the  space group.
A possible problem with these configuration might be, that in most of them, are actually in contact with each other because of the repairing map, and when any two van der Waals spheres of two molecules touch, the energy should go to infinity. So, let’s try another approach.
Since the algorithm performs a Riemannian gradient ascent on a manifold of parametric probability measures, the time evolution of the distribution parameters can be thought of as a trajectory of an autonomous dynamical system. After each iteration, I save the system’s state, and when the algorithm finishes, I can return to that state and generate as many samples as necessary.
For example, after completing the run described in this post ETRPA – repairing unfeasible solutions , I take the state where the maximum packing was sampled
and generate packings with density higher than from this distribution. However, this time, I skip the repairing step and only check for overlaps. It takes a bit longer to get packings with density above without the repairing process, but the molecules do not come into contact with each other in the resulting configurations.
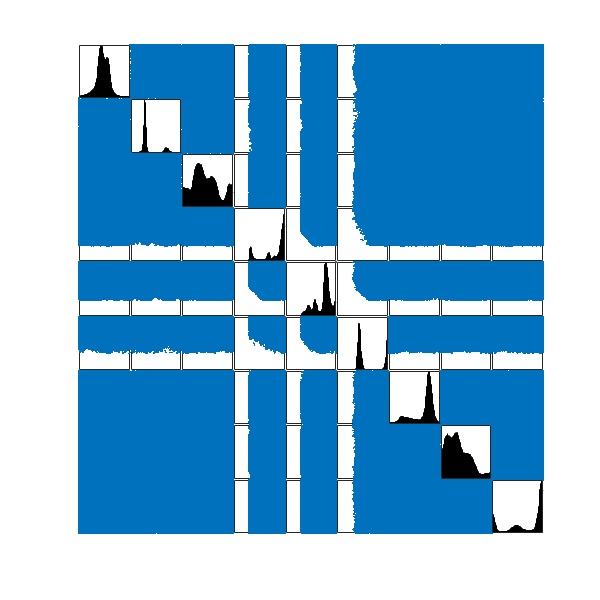
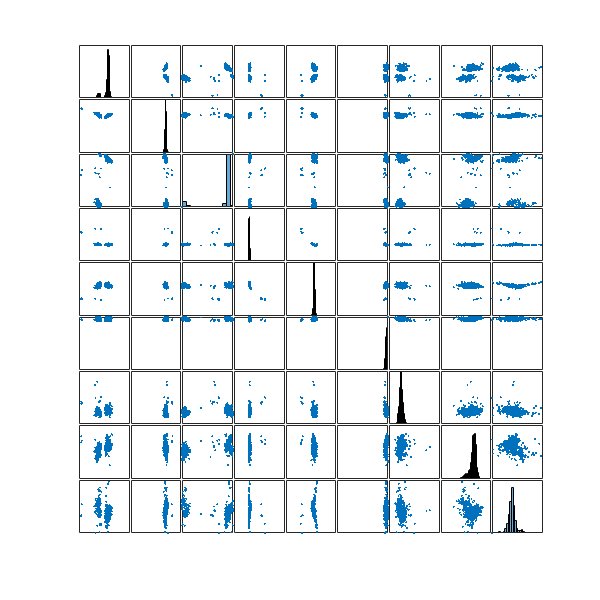
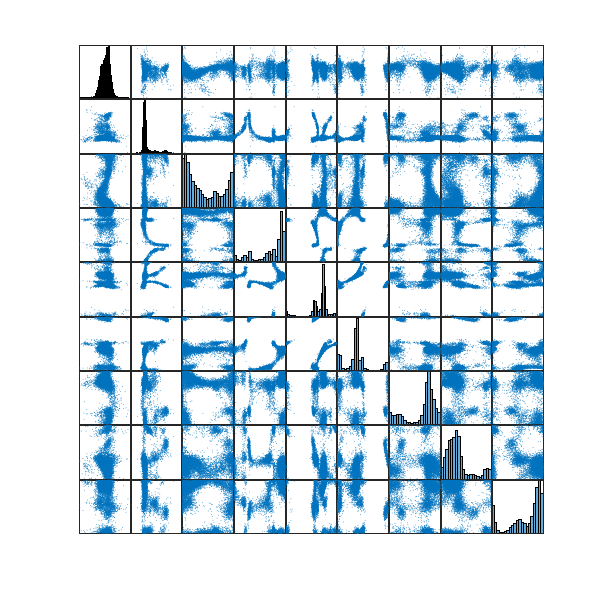
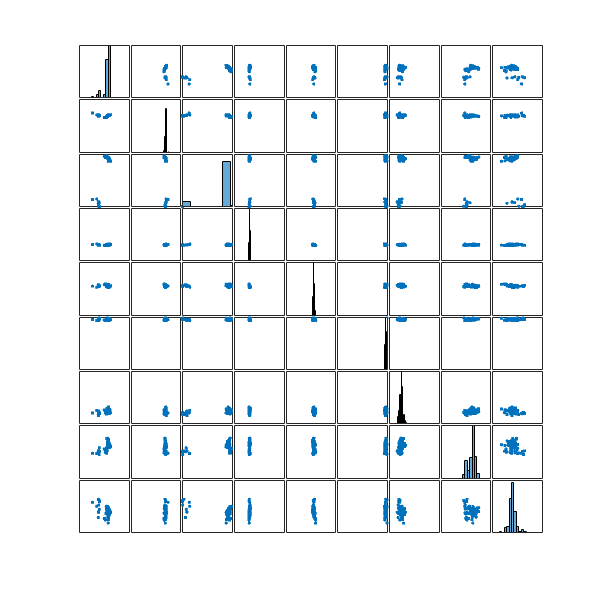
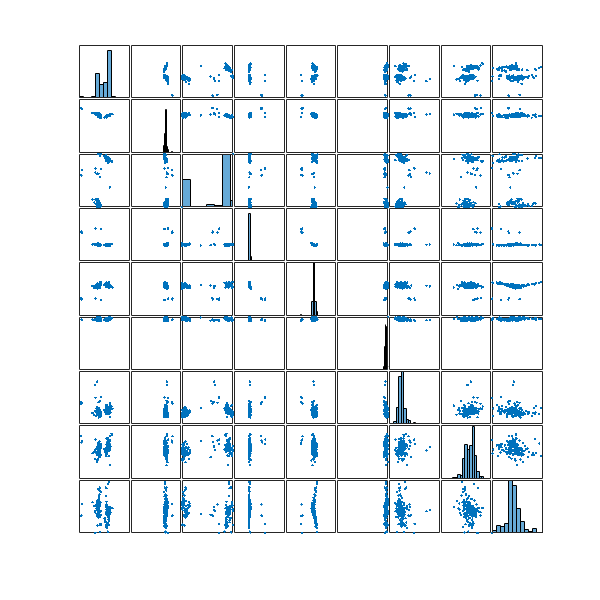
Let’s take a look at the distribution of these 100 configurations in my configuration space
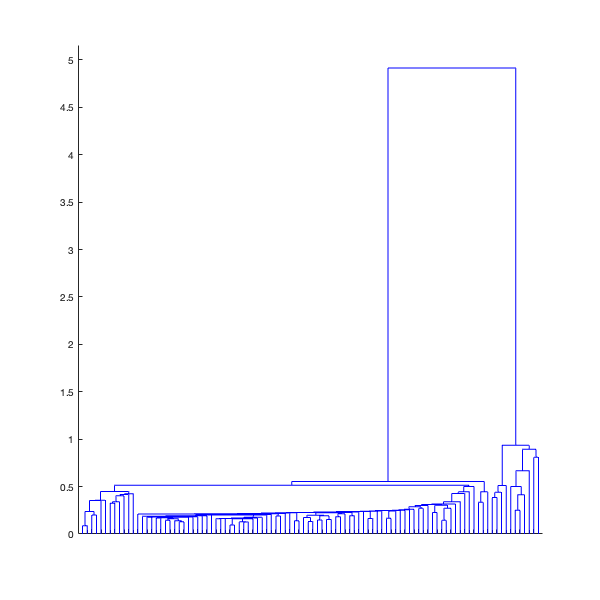
,the single-linkage hierarchical clustering dendrogram
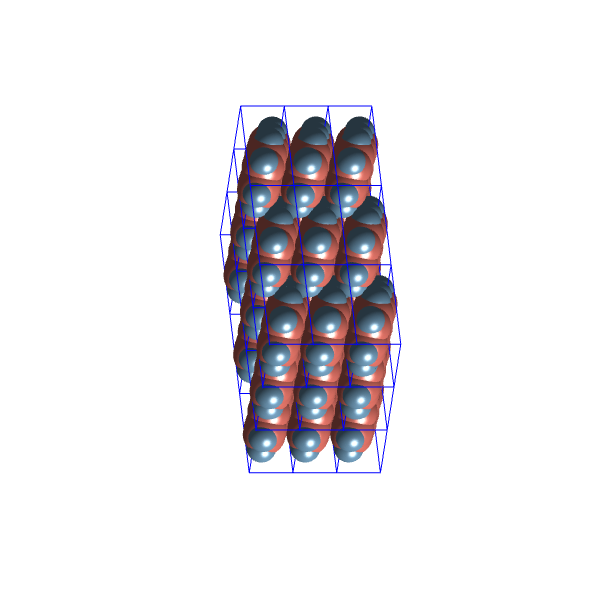
and the two most distinct structures in this set

Density: 
Density: 
Again, it seems they don’t look that much different. Perhaps the best would be to merge the structures selected from the entire optimisation run with the structures generated without repair from the distribution where the maximum packing was sampled
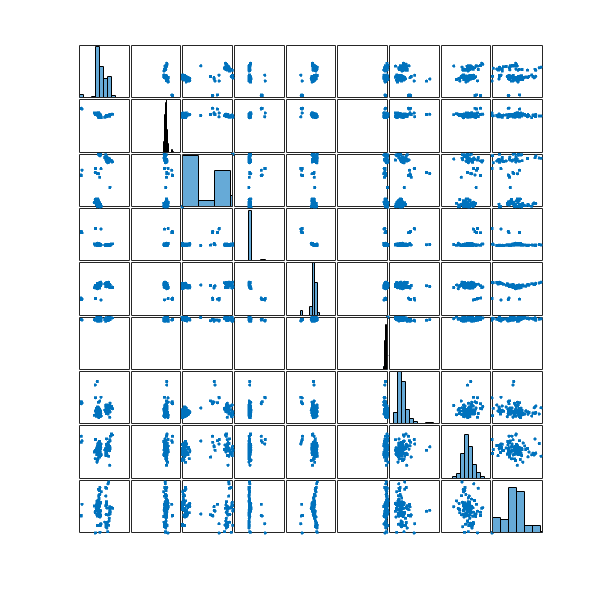
and then use the single-linkage hierarchical clustering to create clusters

to reduce the number of structures to by taking the configuration with highes density in each cluster

In this set of packings,  are from the set of selected structures in the optimisation run, and the ramaining
  are from the structures sampled without repair.
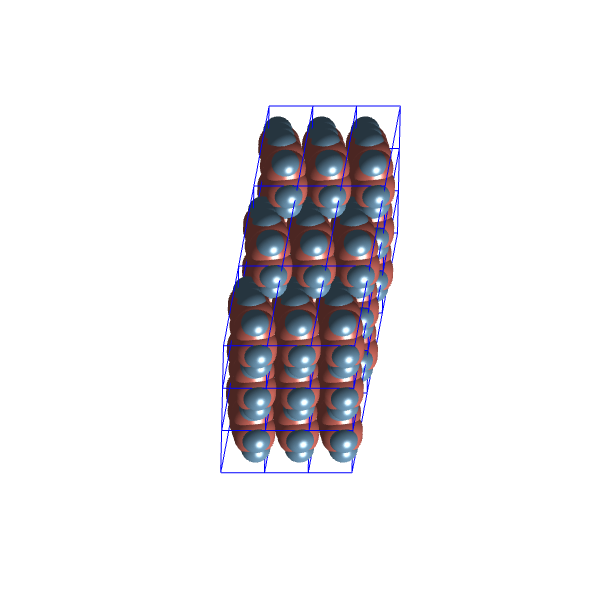
Here are examples from the two most distinct clusters, one obtained from the set without repair and one from the optimisation run set:

Density: 
Density: 
They still look like the same configuration, just realised with alternative unit cell parameters. I’m going to blame the lack of variability in the plane group for this.